Five stars are a lie
What Netflix, Amazon, and AI products taught me about choosing a rating system.
On March 17, thumbs-up and thumbs-down feedback went live in Amoura.
How many options. What shape. What the resulting data would actually be worth. The kind of decision that sounds like a product-management bikeshed until you realize Netflix spent fifteen years and collected more than ten billion ratings learning what not to do.
So I went down the hole.
The answer I came back with was binary: thumbs up, thumbs down. The number of buttons turned out to be one of the least important parts of a rating system.
The useful unit of feedback is a clearly defined question, answered cheaply, with enough context to change what the product does next.
Everything else is decoration.
The menu
Rating systems, stripped to their mechanics, come in about six shapes.
Binary. Thumbs up, thumbs down. One bit at most. YouTube, Netflix, Reddit, and most AI chat products.
Star scales. Usually five points, occasionally three or four. Amazon, Google Maps, Yelp, Goodreads, the App Store, and Uber.
Fine-grained scales. IMDb’s 1–10, Pitchfork’s 0.0–10.0, Metacritic’s 0–100. The domain of critics, academics, and anyone confident that 7.3 means something different from 7.4.
Emoji reactions. Categorical and multidimensional. Expressive for people, awkward for databases.
Implicit signals. No rating control at all. Skips, completions, repeats, saves, returns, abandonment. Sometimes leaving is the clearest rating a user gives you.
Aggregated binary. Rotten Tomatoes classifies each critic’s review as Fresh or Rotten, then displays the percentage that were positive. Binary at the input, continuous at the aggregate.1
That is the catalog. Humans do not use those controls the way their designers imagine.
The J-curve, or: five stars is a lie
Nan Hu, Paul Pavlou, and Jie Zhang studied the distribution of Amazon product ratings rather than just their averages. They found the same shape across product categories: a huge spike at five stars, a smaller spike at one, and very little in between. A J-curve.2
Not a bell curve. Not a population calmly expressing five levels of opinion.
Two biases explain it.
Under-reporting bias. People who feel mildly about something often do not rate it. The people who show up loved it or hated it, creating a U-shape at the extremes.
Purchasing bias. The people rating a product chose to buy it. They selected themselves as likely to enjoy it before the rating prompt ever appeared. That skews the U positive, and the U becomes a J.
The controlled experiment isolates the selection effect. When the researchers assigned products and required everyone to review them, the ratings became approximately unimodal. When reviewing was voluntary, the J returned.3
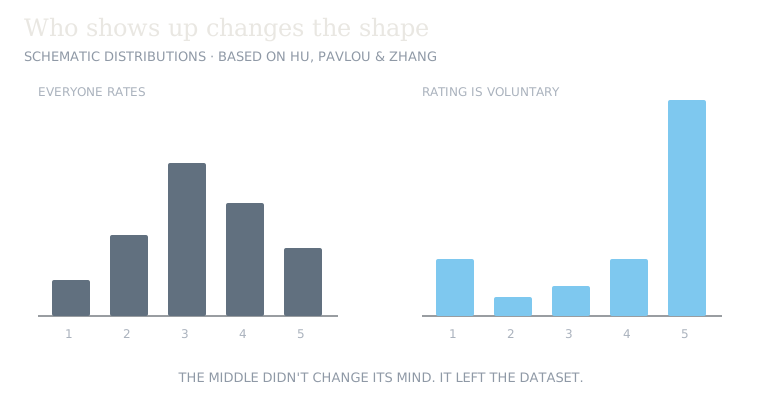
There is a statistical name for this: missing not at random. The chance that a rating exists depends on what the absent rating would have been. The middle does not merely receive fewer stars; the middle quietly leaves the dataset.
No clever averaging can reconstruct the opinions of people who never showed up.
Five buttons, two opinions, and three decorative choices.
YouTube saw the same pattern in its own data. In 2009, product manager Shiva Rajaraman published the platform’s star distribution: overwhelmingly five stars, some ones, and almost nothing between. His conclusion was blunt: ratings were acting as a “seal of approval,” not an editorial measure of what the community thought.4
YouTube switched to like/dislike shortly afterward.
The Netflix arc
Netflix is the canonical case because its star system did not fail by ordinary product metrics.
Members had submitted more than ten billion star ratings. More than half had rated at least fifty titles.5 Participation looked healthy. The dataset was enormous.
A dataset can be enormous and still answer the wrong question with extraordinary confidence.
Stated versus revealed preference
Netflix found that people gave prestigious documentaries high ratings while repeatedly watching lighter entertainment they had rated lower. Todd Yellin, then VP of Product, framed it as a choice between what someone said they admired and what they watched ten times more often.6
The star was measuring aspiration. Behavior was measuring desire.
Those are both real signals, but they answer different questions. “What do I want to believe about my taste?” is interesting. It is not necessarily the best input for “What should I watch tonight?”
Netflix’s separate disclosure that members had watched more than 500 million hours of Adam Sandler films made the point with unusual force. Humanity had spoken. It just had not used the rating control.7
The mental model was wrong
Netflix’s stars were personalized predictions: we think you would rate this 3.5. But people were accustomed to stars representing a community average. Netflix says many members were confused about what the rating meant.8
The familiar star interface suggested a community average, while the product used it as a personalized prediction.
Netflix replaced stars with thumbs in 2017. During testing, rating activity increased by 200 percent, roughly three times as many ratings.8
The test changed only the cost of answering.
Binary eventually found its limit
In 2022 Netflix introduced Two Thumbs Up to distinguish “liked it” from “loved it.”9
Pure binary had flattened an important difference. Netflix did not return to five stars; it added one piece of resolution that it had evidence it needed. The result is an asymmetric three-point scale: dislike, like, love.
What AI products learned about feedback
Across the major AI assistants I reviewed, binary is the dominant inline feedback primitive. The differentiation happens after the click.
That makes sense. A thumb cheaply captures valence: something went well or badly. The follow-up captures diagnosis: what happened, what context matters, and what somebody should do about it.
The mature pattern is two-stage:
- Low-friction binary. Get the initial signal without making the user complete a form.
- Optional diagnosis. Ask for a reason, category, or comment only after the first commitment.
Gemini lets people attach a reason or additional feedback and explicitly bundles the associated conversation with the submission. Microsoft 365 Copilot asks what went right after a positive rating and what went wrong after a negative one. OpenAI and Anthropic both warn that conversation context associated with explicit feedback may be used for model improvement or training.10 11 12 13
The thumb is the visible bit. The context is often the useful payload.
That also makes feedback a privacy decision. In a product handling intimate conversations, what accompanies the thumb belongs in the consent model.
One correction to the usual AI-feedback story: a user click does not necessarily flow directly into an RLHF update. It may enter product analytics, human review, safety monitoring, evaluation datasets, supervised fine-tuning, or model training. “We collect feedback” describes the entrance to a pipeline, not the destination.
A thumb is not a meaning
Binary removes ambiguity from the number of choices. It does not remove ambiguity from the question.
A thumbs-up might mean:
- This was enjoyable.
- This was correct.
- This solved my problem.
- Show me more like this.
- I endorse this publicly.
Those are not interchangeable labels.
Netflix makes the consequence explicit: thumbs teach the system what to recommend. The user is not publishing an objective review of a film. They are giving their own recommender an instruction.8
Before choosing the scale, define the verb. What exactly is the user telling the product to do?
For Amoura, the answer matters more than whether the control has two points or three. Are we rating the usefulness of one response? The quality of a recommendation? The emotional experience of the interaction? The kind of future behavior the user wants from the product?
A clean binary value attached to a muddy question is still muddy data.
The statistics, with fewer miracles
The statistical case for binary is useful, but it is easy to oversell.
Stars are ordinal
A four-star rating is ordered above three, but the interface does not prove that the psychological distance from two to three equals the distance from four to five. Calculating a mean assumes those intervals are comparable.
That assumption can be pragmatically useful. It is not a law of nature. Analyses designed for ordinal outcomes preserve the ordering without pretending the distances are known.14
Binary outcomes have a mature toolkit: proportions, binomial intervals, logistic regression. Simpler data does not eliminate bias, but it makes fewer promises about precision.
Bits are ceilings, not guarantees
A balanced binary variable can carry at most one bit of information. Five equally likely outcomes can carry about 2.32 bits. Those are theoretical maxima.
When most ratings pile into one or two categories, entropy falls. Five visible choices do not guarantee five choices’ worth of information.
Real rating distributions rarely approach those ceilings.
The Netflix result is the practical trade: each rating may contain less resolution, but the lower-friction control generated roughly three times the volume. Whether that wins depends on the observed distributions and participation rates, not on counting buttons.
The denominator matters
We need to instrument the opportunity to rate, not just the ratings: when the control appeared, what preceded it, whether the user engaged, and how that propensity changes by cohort.
A hundred thumbs from a thousand impressions means something different from a hundred thumbs from ten thousand.
The absence of a rating is not neutral. Sometimes it means indifference. Sometimes the user never noticed the control. Sometimes they left annoyed before it appeared.
Analytics has an unfortunate habit of calling all three null.
What psychometrics actually says
The psychometrics literature does not conclude that binary is the highest-quality measurement scale.
Lee and Paek found little difference among four-, five-, and six-category scales, and the largest deterioration when scales dropped from three categories to two.15
But they were studying multi-item psychoeducational instruments: motivated respondents answering a sequence of questions designed to measure a latent construct. That is a different job from getting someone to react to one recommendation before closing an app.
That research measures a different job under different conditions.
If respondents are motivated and precision matters, as in medical assessment, academic research, or professional evaluation, the cognitive budget exists and extra resolution can be real.
If the user is half-distracted, the product needs volume, and behavior supplies additional signal, participation may dominate per-response measurement quality.
Where scales collapse
Some systems nominally offer five points but behave as binary systems under social pressure.
Rideshare ratings are the cleanest example. A rider may intend four stars to mean “good.” A driver may experience it as a complaint. Once marketplace thresholds, livelihoods, and politeness enter the system, the semantic scale compresses: five means acceptable; anything lower means a problem.
Four stars: a compliment at a restaurant, a performance incident in a rideshare app.
Aggregates have another problem: fossilization. After ten thousand ratings, neither a 4.3 average nor a 73 percent positive score moves easily. Percentages are not mathematically more responsive than stars. If the underlying product changes, the data model needs time windows, version boundaries, segmentation, or recency weighting. Changing the icon does not make old evidence young again.
And if the rating affects what the system shows next, the data becomes endogenous. The recommender chooses what users can rate; the ratings change the recommender; the next dataset reflects the earlier model’s choices. You are not passively measuring taste. You are participating in its observed distribution.
So what do you pick?
The evidence points to a framework rather than a universal winner.
If users are casual and volume is the bottleneck: start with binary or three-point feedback.
If respondents are motivated and measurement precision is the job: use a validated multi-point instrument appropriate to the construct.
If behavior is observable: treat explicit ratings as a supplement. Skips, completions, repeats, saves, returns, and abandonment often reveal what users will not articulate.
If feedback affects someone’s livelihood: audit what the scale means in practice, not what its labels claim to mean.
If you need diagnosis: collect the cheap valence first, then offer an optional structured follow-up.
If you display an aggregate: preserve distributions, uncertainty, sample size, and time. A decimal is not confidence.
Do not start with five stars because “we can always simplify later.” Converting historical stars into binary requires choosing a threshold that users never agreed to. Does three mean positive, neutral, or disappointed? The conversion does not merely lose resolution; it invents semantics after the fact.
Start with the simplest signal that can answer a defined question. Add resolution when observed mistakes show you what distinction is missing.
What I picked for Amoura
For Amoura, the explicit signal is binary: thumbs up, thumbs down.
The user base is casual. The cognitive budget is low. Behavioral signals such as return frequency, session depth, and interaction patterns can carry much of the recommendation weight. The explicit rating is a confirmation and correction layer, not the sole source of truth.
The implementation matters as much as the control:
- Log rating impressions, not just clicks.
- Keep diagnostic follow-up optional.
- Define exactly what object the thumb evaluates.
- Preserve the context needed to interpret feedback without quietly expanding the privacy boundary.
- Watch participation and outcome quality by cohort.
- Treat nonresponse as a behavior to investigate, not an empty cell to ignore.
Netflix added a third point five years after going binary, once it had evidence that “like” and “love” needed to be separate. That is the sequence I want.
If Amoura eventually adds a third point, it will be because the mistakes in the data reveal a distinction we cannot recover from behavior, not because five stars looked familiar in a wireframe.
We’ll add resolution when we have the receipts.
Footnotes
-
Rotten Tomatoes defines the Tomatometer as the percentage of approved critic reviews classified as positive; at least 60 percent is considered Fresh. “About Rotten Tomatoes.” ↩
-
Nan Hu, Paul A. Pavlou, and Jie Zhang, “Why Do Online Product Reviews Have a J-Shaped Distribution?” The manuscript circulated in 2007 and was published as “Overcoming the J-Shaped Distribution of Product Reviews,” Communications of the ACM 52, no. 10 (2009), 144–147. DOI: 10.1145/1562764.1562800 ↩
-
Hu, Pavlou, and Zhang also report a controlled experiment in which all participants reviewed assigned products; unlike voluntary Amazon reviews, those responses were approximately unimodal. SSRN working paper. ↩
-
Shiva Rajaraman, “Five Stars Dominate Ratings,” Official YouTube Blog, September 22, 2009. ↩
-
Contemporary reporting on Netflix’s 2017 product briefing states that members had submitted more than ten billion ratings and that more than half had rated at least fifty titles. MacRumors, March 17, 2017. ↩
-
Todd Yellin contrasted highly rating a serious documentary with watching an Adam Sandler movie ten times more frequently. The Verge, March 16, 2017. ↩
-
Netflix disclosed the viewing-hours figure separately in its 2017 earnings reporting. Time, April 18, 2017. ↩
-
Cameron Johnson, “Goodbye Stars, Hello Thumbs,” Netflix, April 5, 2017. ↩ ↩2 ↩3
-
Christine Doig-Cardet, “Double the Thumbs for Even Better Recommendations,” Netflix, April 11, 2022. ↩
-
Google says Gemini feedback includes the associated conversation and may include uploaded files, images, and connected-app content. Gemini Apps Help, accessed July 2026. ↩
-
Microsoft documents symmetric positive and negative follow-up for Microsoft 365 Copilot and says that feedback is used for product improvement rather than foundation-model training. Microsoft Support, accessed July 2026. ↩
-
OpenAI says an associated conversation may be used for model training when a user explicitly submits feedback, even if ordinary conversation training is disabled. OpenAI Help Center, accessed July 2026. ↩
-
Anthropic says explicit thumbs feedback may be used for training and the related conversation may be retained for up to five years. Anthropic Privacy Center, accessed July 2026. ↩
-
Simms et al., “Best Practices for Binary and Ordinal Data Analyses,” Behavior Genetics 51 (2021), 204–214. ↩
-
Jihyun Lee and Insu Paek, “In Search of the Optimal Number of Response Categories in a Rating Scale,” Journal of Psychoeducational Assessment 32, no. 7 (2014), 663–673. ↩